Chapter 3.7 The electromagnetic “spectrum”.
- A) The prism spectrum
- 1. The contemporary physics ignores what an electromagnetic “spectrum” really is. Let’s start saying that all the scientific texts on the subject assert that the “lines” of the spectrum are “images of the slit” of the spectroscope: it is – as our readers have already understood – a colossal and general nonsense: the lines of the spectrum are, in reality, the arches of our propagation, displaying pulsation phenomena (normally, the thicker lines) and inter-incidence (usually, the thinner ones), as we can now verify.
- 2. In fact, we have already described the phenomenon in the article Magnetism and earthquakes dated 1972 and reported in section 4, figures 5 and 6, that reads:
“The structure of the valve faithfully reproduces the shape of a gravitational field or – that is the same – “magnetic” field, variable only for frequency, wavelength and intensity from the electromagnetic range to those of meso- and mega-magnetic waves. In this respect, it is significant to note that on the outside of a shell the spectrum of the propagation is printed: the converging spiral lines delimit some bands, where the “lines” are the small arcs of circumference of the propagating waves”.
Therefore, we only have to complete the study on this subject. We do this by starting with the simplest case presented to us by the nature. Pic.46 (from Enciclopedia Italiana, Spettroscopia) shows the “Balmer series” of atomic hydrogen (the spectrum of the molecular one is, of course, much more complicated), in the purest conditions of observation. There are four lines in the visible and many others in the ultraviolet, whose succession “converges towards a limit, said limit of the series (Seriengrenze in German), which is located on the side of the smaller wavelengths.”
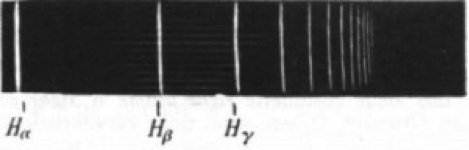
Fig. 46
As it always happens with the modern physics, the maximum that it can do is to deduct from the empirical observation the numerical law of the rows succession in the different series that the spectrum shows (the ultraviolet series of Lyman, the infrared series of Paschen, etc.), although nobody will ever derive the slightest understanding of the shaping cause of those lines, except the ridiculous reason that they are “images of the slit”.
- 3. Let us assemble some other descriptive data can be derived from the texts. Always from Enciclopedia Italiana about the distances between the lines:
“They decrease according to a very simple law, that is in the same way as the reciprocal of the squares of integers”, having the limit – as said – “on the side of the small wavelengths”.
From EST Mondadori:
“The row spectrum of the hydrogen atom is the simplest: in the visible and in the ultraviolet next to it, it is constituted by a relatively small number of lines, whose mutual distances and intensity decrease on a regular basis towards the smaller wavelengths.
Bands Spectrum. It is a discontinuous spectrum, consisting of series of very close lines, typical of molecules and chemical compounds. (…) it is formed by very wide asymmetrical lines (bands) which have their maximum intensity in the low frequency region (band head). ”
Enciclopedia Italiana:
“The spectral lines in a prism spectroscope are always shown as curved with the convexity towards the red edge of the screen. This depends on the fact that only the rays that come from the centre of the slit pass through a main plane.”
The latter motivation is just as valid as the aforementioned “slit image” for the explanation of the lines. Apart from this attempt, you will not find in the dissertations on this subject any physics related reasoning that can clarify nature and modalities of the phenomenon.
- 4. Unlike academic physicists, who will continue not to know anything about it, by watching fig. 46 our readers will have already guessed that the distancing of the lines from “the limit of the series” (located on the right) has a logarithmic nature, similar to the logarithmic spiral of our eccentric propagation. And since we have explained above that the rows are “lines of force” determined by the pulse, we now only have to present again fig.31 of chapter.3.6 in fig. 47 in a polar projection rather than equatorial: by doing so, the lines of one of the possible series will appear very evident along the equator of propagation (in projection, an ideal horizontal axis, the centre line of a visual band limited by the slit), like small arches thicker than those of the non-pulsed waves, with a similar spacing to that of fig.46.
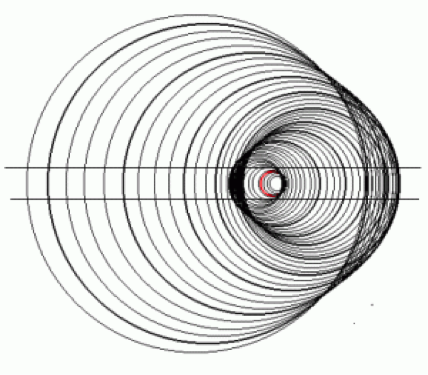
Fig. 47
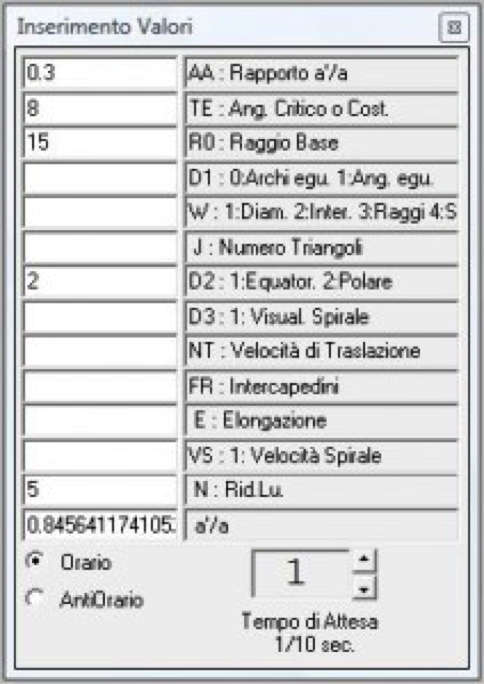
To obtain this image with OLOPOIEMA, simply replace in the window INSERIMENTO VALORI the value 2 instead of 1 in D2, among the inputs of the aforementioned fig.31: the equatorial projection will move to the polar one, pressing AVANTI until the desired point is reached.
The propagation of fig.47 is the one that spreads toward the observer, when the dispersive means is a prism, and it is of eccentric shape (unequintense sources), because the escape interactions of incident photons on the particles of the means cause the separation between major and minor photonic aggregates: the first, which are less deviated than the seconds, like in a mass spectrograph, gather on the longer wavelengths (perceived as red, within the effective area of the propagation on the screen). If the dispersive means is instead a grating, we will soon see that the resulting propagation shape is concentric, because it is generated from the undulatory composition between mutually equintense eccentric propagations. The difference between the prism logarithmic spectrum and the lattice concentric spectrum (the latter with rays proportional to the square roots of integers) is a remarkable confirmation of our undulatory laws if put in comparison with the risible descriptions of the current optical physics, which speaks of ” plane waves “and draws snake shaped waves.
- 5. Let us examine the characteristics of our fig.47, to be compared with the descriptions of the phenomenon made by the usual physics.
Thicker arcs having their convexity towards the longer wavelengths, i.e. towards the red spectrum, are displayed along the horizontal axis (not shown – projection of the equatorial plane of propagation), as an effect of pulsation around the source (the body circled in red). It is therefore far more than the distorted images of the slit. The non-marked wave fronts are bypasses and, therefore, do not form “lines of force” (or rows).
The spacing of the arches from the “Series limit”, represented by the centre of the source, is clearly logarithmic as the propagation. The different series are generated by the different gravitational ratio a’/ a between the components of the source. Here is in fig.48 the different result which is obtained in the spacing between the lines by substituting in the inputs, for that ratio, the value 0.2 to the value 0.3 of fig.47:

Fig. 48
The peripheral logarithmic spiral, which runs through the longer wavelengths on the equatorial plane of propagation (of which the ideal horizontal axis is the projection) marks the geometrical locus of “escape” of the photonic flows outwards, so that they gather there and it is for this reason that the greater intensity of the radiation occurs in the red areas of the spectrum, that is to say in those with a low frequency or with the maximum wavelength (fig.49).
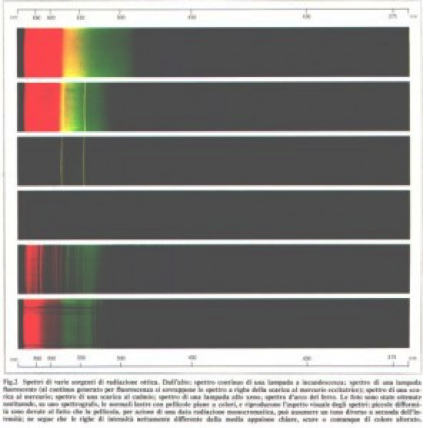
Fig. 49
- 6. The spectrum of a substance that is interposed between an emissive optical source and the observer contains the same “lines of force” (or rows) of the substance in emission, whose corpuscular radiation is escaping from the emitting source towards the observer and the lines are therefore bright (emission lines), whereas it is in collision with the absorbent and the lines are, as a result, dark for the observer (absorption lines).
Both “continuous” spectra of solids and liquids and “bands” spectra of molecular aggregates are due to the complexity of the atomic-molecular constitution, which melts and blends with each other dense systems of pulsation lines and of inter incidence, as we are now going to show (fig.50).
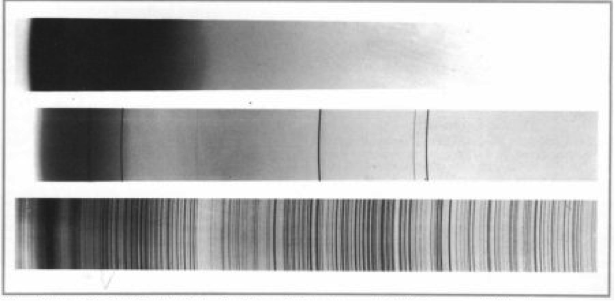
Fig. 50 – Spectrograms recorded on a photographic plate. The three emission spectra shown in the picture are from top to bottom: a continuous spectrum overlaid by a lines spectrum and a typical lines spectrum. The first spectrum was obtained by analysing the radiation emitted by a common incandescent lamp, the second analysing the radiation emitted by a fluorescent lamp, whereas the third is the arc spectrum of iron, often used as a reference sample. The left margin of the spectrogram corresponds to wavelengths of about 700 nm, the right margin at wavelengths of about 300 nm. The photographic image is printed in negative, so the light lines appear as dark lines on a light background, likewise the absorption spectra.
Fig. 50
In the spectra of very distant sources – such as the stellar ones – the arched shape tends to appear rectilinear, due to an evident geometric pattern (see Section C of this chapter).
- 7. The spectra of atomically complex substances, like that shown in fig.51 (Enciclopedia Italiana, Spettroscopia) have in addition to the lines of pulsation, whose series are generally regular and can be determined by a formula, many other lines formed through inter incidence which confuse the mathematical regularity of the series of lines.
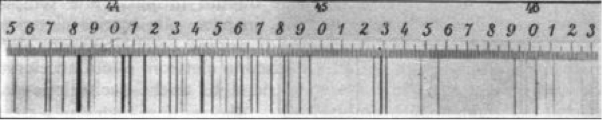
Fig. 51
We have created one, placing in polar projection the image of fig.43 of cap.3.6 C), which is the superposition of two propagations (grey and black), making it more complex by entering N = 5, in order to thicken the pulsations, and superimposing two other propagations ( green and blue) with the same inputs but with VS = 1, so to create a new pair of wavelengths (fig. 52). The equatorial zone of such multiple propagation reproduces very closely the spectrum of fig.51, assuming to that the wave fronts are not bypasses but already an effect of previous inter incidences, as always happens in nature. It is very evident the lined structure – and the bands structure where they are closer together– of a visual strip ideally traced along the equator (the areas altered by the perspective trend of the propagation have to be excluded from the examination).
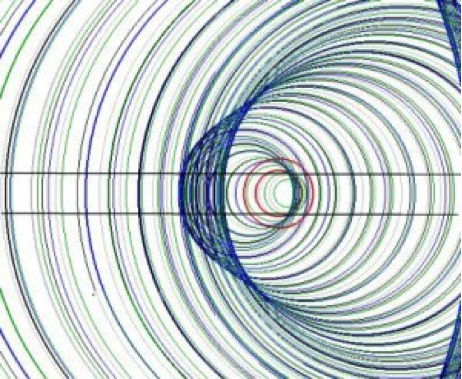
Fig. 52
- B) The grating spectrum
- 8. Let us move on to the grating spectra. Despite the different construction methods, the “diffraction grating” equate in making the subdivision of the radiation of a single source into several small coherent sources, all equal, beyond which the radiation “recomposes” into a fringe spectrum, where the wavelengths increase proportionally with the increasing of the distance from the spectrum centre. The shape of the gratings (rectilinear or circular) and the different orientation of the observation plane (the screen) with respect to the sources divided by the grating, determine different forms and appearances of the spectrum. The true reality of this phenomenon is observed in the simplest experience, that is, when the radiation is divided between two small circular sources (two holes in Young’s interferometer) and the observation plane is central and perpendicular to the line joining the two sources.
Let’s read the result in Interferometry, EST Mondadori:
“For intersections with a perpendicular plane to the straight line joining the sources, the fringes are concentric circles whose radius increases with the increasing of the square root of integers”.
This is exactly what says our law regarding the “wave composition” between two equintense sources.
As mentioned in § 4, the escape interactions of incident photons with the corpuscles of the dispersive medium (in this case, the periphery of the hole) cause an eccentric propagation at the exit from the hole, which composes in an undulatory way with the equintense propagation of the other hole and generating a concentric propagation “daughter” pictured from its circular intersection with the screen. Hence the fringes of “Newton’s rings”, with radius proportional to the square roots of integers, by the increasing of the wavefronts in proportion to the times.
- 9. At this stage another misconception of traditional physics succeeds, which derives from its total ignorance of the nature of the phenomenon. Since the sequence of colours in the fringes from the centre to the periphery ranges from violet to red, we read in the texts that the grating would deflect the red more than the violet, unlike the prism (§ 4), without saying and knowing the reason, as usual.
The ignored reason is, in fact, this below. Let’s refer to the question of the pulsation in the concentric, reporting here fig. 36 of chapter.3.6 B in fig.53:
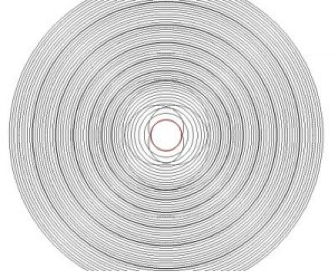
Fig. 53
Being a concentric spherical propagation, the polar projection which is now required (§ 4) coincides with the equatorial projection , but Archimedes spirals equatorially driving the propagation should here be cancelled. Readers, therefore, will disregard them. We advise you that the architectural data of the image are, as we know, purely exemplifying and therefore the argument explains the phenomenon and does not strictly adhere to a precise natural structure.
The pulsation has marked the propagation in seven bands of wavelengths, which are increasing from the centre towards the periphery. The innermost band trespasses towards the nucleus in a central spherical zone of gravitational balance between the eccentric propagations components (those of the two holes) and therefore devoid of dispersive effect. At this point we would be simplistically tempted to match the seven bands with the seven colours of the rainbow, that is – proceeding from the middle – from violet to red based on the increase of wave lenghts. But in this way it would be inexplicable from a physics point of view the reality of the phenomenon, which sees the repetition of the spectra of both sides in various orders (1st, 2nd,…).
This happens because, contrary to what the current optics physics believes, the dispersion does not operate from the centre, but is the result of deviation operated on the incident photons by the two holes, which have resulted in an eccentric double propagation polarly counter-oriented, regularly flexing the red rays less rather than the violets towards the centre, like the prism, and therefore, seemingly flexing the reds more than the violets when starting from the centre.
- 10. Once corrected this basic capital mistake, we move on to explain all the other modalities of the phenomenon. The scanning in several orders of the spectra with the colour repetition is due to the fact that the concentric “daughter propagation” drags the photons (these latter raining down from the dispersion operated by the holes) on its own waves, which succeed one after the other expanding in equal successive times for equal surfaces, namely with rays proportional to the square roots of integers, where each of them is the bearer of a spectrum. This leads to a result that makes our reasoning indisputable: since the wavefronts “pickers” of the concentric get closer from the centre towards the periphery, whereas the bands of increasing wavelengths get wider, the spectra conveyed by the concentric waves are forced to superimpose wider and wider peripheral zones between reds and violets of contiguous wavefronts.
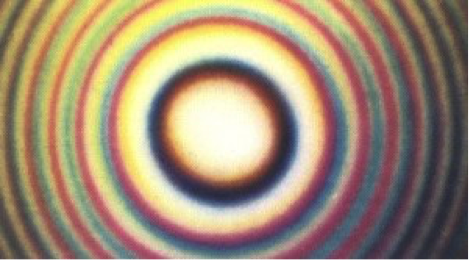
Fig. 54
- C) Andromeda problems
FIRST PROBLEM:
The analysis of astronomical spectra by the official physics offers the most impressive examples of his utter ignorance of the nature and the true interpretation of the phenomenon, such as reading the “red shift” as a Doppler effect and its resulting inventions (recession of galaxies, big bang, etc.). But the most funny and definitive proof of naivety of the current astronomy on the scientific use of spectroscopy is given by the article “The dynamics of Andromeda galaxy” by Vera C. Rubin published on LE SCIENZE no.62 (October 1973) ( fig.50-2).
Fig. 50-2
Let’s start by the detail related to the essentially curvilinear shape of the lines, which are actually arcs of spherical propagations and keep being arcs, even when due to the distance of the source they generally tend to appear as straight lines. We have seen in § 3 an attempt of explanation of that convexity provided by Enciclopedia Italiana: we now find another one, quite different, linked to the general thesis asserted in the article. On page 19 the caption of a series of spectra detected by Andromeda reads:
“The spectral lines are curved due to the rotation of M31” (Andromeda galaxy)”.
Instead of vainly trying to reconcile the two explanations, let us deal with the thesis that the article wants to demonstrate through the spectral analysis: the rotational motion of Andromeda and its modalities. We will let Vera C. Rubin have the floor, by posting images and textual statements. But first we will try to solve the issue by ourselves, to check whether the eye sight – ours – really needs Rubin’s very special glasses, or if by chance she is the one who needs to be urgently accompanied to see an ophthalmologist.
On fig.50-3 we quote both the image and the caption on page 13 of the magazine. We mark the four vertices of the photograph with the astronomical abbreviations, from top left clockwise: NE, NW, SW, SE.

Fig. 50-3 – Andromeda galaxy, also known as M31, is the closer spiral galaxy similar to ours. It has been photographed by the 1,20 meters Schmidt telescope of Palomar Mountain. The rectangle encloses the region shown in detail on page 14.
Please now suppose to have in front of your eyes the image of the galaxy by using your right hand. The galactic nucleus disc, with the spiral arms clearly visible NE and SW, will not be front as the back of the hand, or cutting as the hand horizontal, but tilted (precisely of 13°), as taking the thumb rather down and the little finger rather up (please refer to the penultimate paragraph of the “Second problem“).
Done this, you only need to know that a spiral galaxy can only rotate in its arms winding direction, that is to say in the direction of movement which is obtained following any of its arms from the outer end towards the confluence in the nucleus. Should you try to make it rotate in the opposite direction, it would be the same as thinking of a cyclone (the ones you see in weather forecasting) that turns upside down, with clouds that instead of rolling up around the ”eye” of low pressure would move outwards.
After mentally picturing the rotary motion of Andromeda, which no doubt shows itself as counter-clockwise, think about one of the stars located in the SW spiral arm, within that rectangle marked in the figure on the bottom right and guess say whether that star is moving towards the Earth or away from it. Because you are not blind or stupid, you will surely answer that the star is moving away. Well, Rubin and his colleague W. Kent Ford jr. have been studying for the past six years the spectra of Andromeda, concluding that the poor little star, unaware of so much attention, is instead approaching, like the butterfly to the candlelight in the famous Neapolitan song Palomma ‘e notte.
If then rubbing your eyes you will move on to NE arm and sensibly you will think that you are now approaching the Earth, Ms Rubin, will relentless alert you of the contrary, asserting that you are moving away. If you do not believe it, please trust that everything is written very clearly in the caption illustrating the southern region of M31 and that we quote on fig.50-4: this is the incredible thesis resulting from a work of six years of tireless study at the telescope, condensed into seven dense pages on the official magazine of our contemporary knowledge and that we dismounted in a minute with the simple use of a hand.
It is only a matter of understanding that the grade of the spectral lines has no real relationship with the galactic rotation, being due instead to the fact that the slit of the spectrograph, arranged along the equator – as the article’s drawings show – collects waves of secondary propagations that distort the main wave configuration, in axis with the galactic disk. This is precisely the reason why, by arranging the slit along the axis, the rows are not inclined, lacking the disturbing cause.
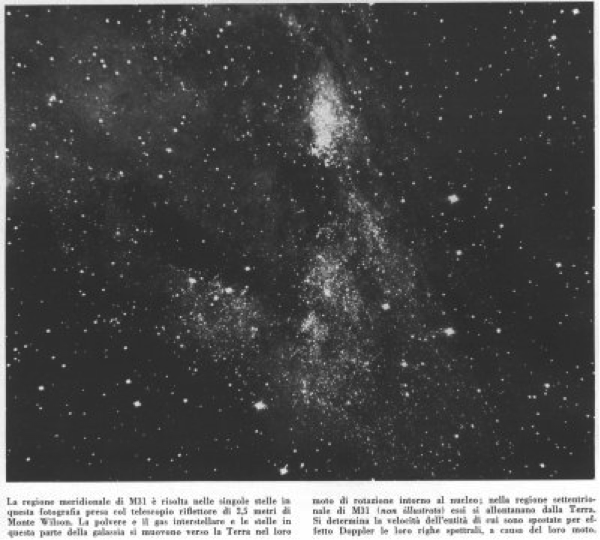
Fig. 50-4
Some time ago I entitled one of my conferences on the argument “Andromeda’s vertigo”. The first seizure was due to love, when she was rescued by Perseus.
SECOND PROBLEM:
The second affront to Andromeda galaxy was made by many astrophysicists, when they photographed it with a wrong orientation. A problem not easy for non-specialists is to understand why many photographs of Andromeda the show it as fig.50-5, namely upside down compared to the exact orientation of fig.50-3.
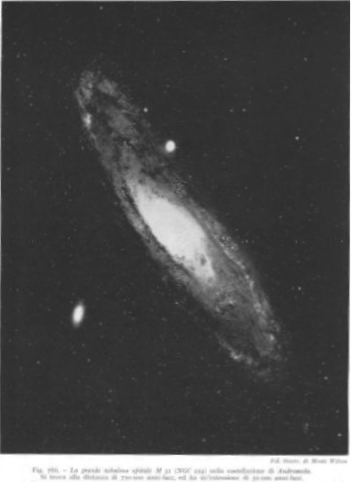
Fig. 50-5
The reason lays in the distinguish apparent diurnal rotation of the stars of the northern hemisphere around the North Star. We classify under this aspect the sidereal bodies as subzenithals, zenithals and transzenithals, in relation to the latitude of the observer.
For each latitude, the angular distance of the North Star from the zenith equals 90° less the latitude: we call it colatitude. The angular distance of any star from the North Star in his diurnal rotation around it does not change instead: this polar distance equals 90° less the declination, which is the latitude of the star with respect to the celestial equator.
It follows that if the polar distance of a star (or a constellation, or a galaxy, etc.) is inferior to the colatitude, it will rotate around the Pole remaining below the zenith: it is a subzenithal star, and the observer will always spot it on the northern part of the celestial vault. The observer will see it rotating from below the Pole – visually straight – to above the Pole – visually capsized. In the intermediate positions he will see it lying in relation to the Pole.
If the polar distance is equal to colatitude, the star will touch the zenith in the middle of his rotation on the south meridian: it is a zenithal star. If that distance is ultimately superior to colatitude, the star will rotate around the zenith (transzenithal star) also entering in the southern part of the celestial vault. In these last two cases the visual capsizing of the star in relation to the Pole will not occur.
Let’s talk about Andromeda galaxy. For the Observatory of Capodimonte in Naples (in terms of mathematical approximation), because the declination of Andromeda is equal to the latitude of Naples (41°), and therefore its polar distance is equal to the colatitude (49°), Andromeda is for Naples a zenithal sidereal body. But if we move to Mount Palomar and Mount Wilson Observatories (respectively 33 ° and 34° latitude), where many of the photographs in question come from, we can easily find from what has been said that there Andromeda is abundantly subzenithal: hence its usual capsizing in the image, since the camera was not correctly oriented towards the Pole so that there was correspondence between the Earth orientation and the one on the celestial vault, with the southern regions of Andromeda pointing at our South, as in pics.50-3 and 50-4, and not at our North, as in fig.50-5.
This is not a minor problem because it follows an easy confusion in the optical and conceptual interpretation of astronomical phenomena by inexperienced people. Fig.50-3 clearly shows us on the apparent ellipse of Andromeda, due to the inclination perspective, the NW side as the farthest from us, for the cut edge on the dark sky, and the SE as the closest, for the greater dispersion of the stars in the background of the sky. However, Fig.50-5 can easily confuse the viewer for optical reasons, leading to invert distances and movements.
However, this fact is not very important to astrophysicists. Their spectroscopy will add confusion to confusion, as we have seen for the first problem of Andromeda. We however inform our readers that the quoted American observers also took photographs oriented in the proper way, like the one published in one of tables of “Encyclopædia Britannica” for the entry “Nebula” and the photograph than can be found in “Atlante dell’Universo Mondadori”. We cannot save instead Fred Hoyle in “Galassie, Nuclei e Quasars”, published by Einaudi, and even the Enciclopedia Italiana for the entry “Nebulose”. But in the same Enciclopedia Italiana we find a correct image of a table for the entry “Cielo”, because the picture was taken in Pino Torinese (45 ° latitude), where Andromeda is transzenithal.
There might be even a worse reason that the one considered for the capsizing of Andromeda in the pictures: the fact that Andromeda is actually seen upside down in the sky and his being upside down is purely telescopic! But in that case we will have to think of astronomers photographers that have a capsized mind themselves… .